
Crop Monitoring Solutions
Enhance your agricultural productivity with our advanced crop monitoring solutions. Utilizing cutting-edge technology, we provide real-time insights for optimized crop management and increased yields.
How it works
Automated Predicted accurate field boundaries using Satellite Imagery and deep neural network model for Field Delineation
Why Using Crop Monitoring

Our Product Case Studies

Key features of Crop Monitoring Solutions

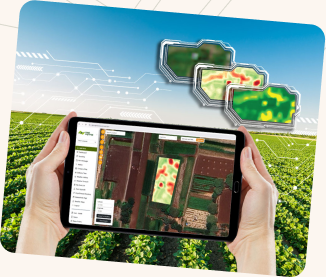
Satellite imagery with its benefits can present situations that can not be seen with regular observation.
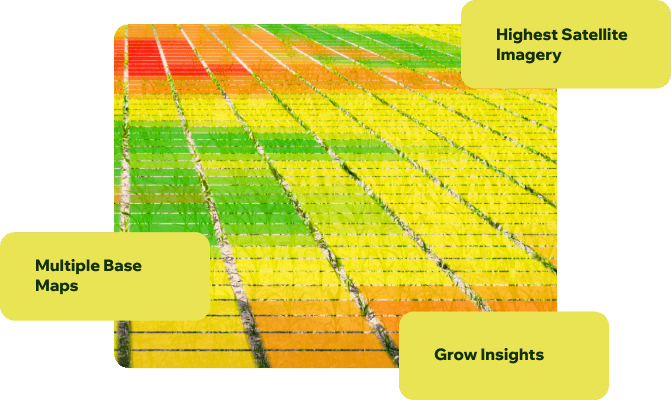
- Industry Highest Satellite Imagery Resolutions
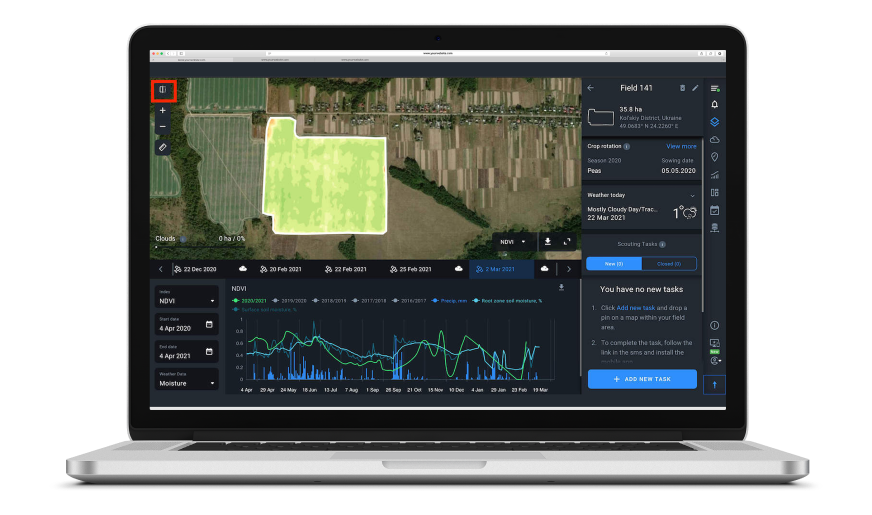
- 40 + Maps which help you understand grow stages status, nitrogen, water, moisture, etc.
- Multiple Base Maps
- Using 6+ Satellites including all-weather Satellite
- 3-5 Days Satellite Revist time.
Our Hyperlocal forecasting is an AI-solution that takes the context of each demand driver within each individual location into account to make accurate demand forecasts on the most granular level
- Hyperlocal Weather
- Tracking 30 + Weather Data Layers
- High-resolution forecasts for up to 10 days ahead
- 20+ Years Historical Data
- Alert on Damaging weather conditions at fields, allowing farmers to minimize risks
Scouting is a key component of integrated pest management (IPM) in agriculture, which involves monitoring crops to identify and manage pest and disease outbreaks before they cause significant damage.
- Identify red patches in your farm using our maps to identify problem areas
- Field scouting involves physically inspecting crops in red areas to identify problems.
- Getting the ideal location to set Traps can be used to monitor pest populations
- Help farmers identify and manage pest and disease outbreaks before they cause damage
- Centralized communication, share with the team and share with the community.
Variable rate application (VRA) is a precision agriculture technique that involves applying inputs such as fertilizers and pesticides at varying rates across a field, based on the specific needs of different areas of the field. VRA can help optimize crop yields and reduce input costs, as it ensures that crops receive the right amount of inputs in the right places.
- Get maps that indicate the appropriate rates of inputs for each area of the field
- Productivity Maps, Vegetations, Productivity Maps and so on.
- Compatibility with top manufacturers equipment
- Set rate for ag input product, calculate product cost, use industry standard equations or create your own
- Auto Identify areas of the field that have different crop growth patterns or nutrient requirements VRA Maps